Paradyn Visualizations (Visis)
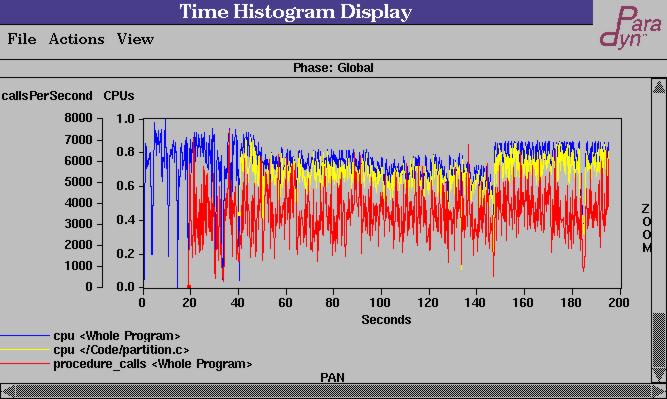
The time-histogram visi plots performance data for metric/focus pairs over time. The time-histogram above shows three curves corresponding to three enabled metric/ focus pairs. The time axis begins at the start time for the phase over which the data is being displayed (in this case the data is displayed for the global phase which begins at time 0). The time-histogram can display multiple y-axes. In the figure above, there are two y-axes displayed; the rightmost one corresponding to the metric CPU utilization, and the leftmost corresponding to the metric 'Procedure Calls'. Each y-axis is labeled with the units in which its corresponding metric is measured.
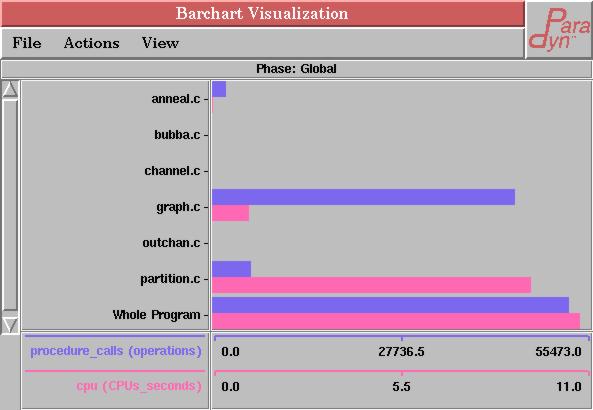
The Barchart visi is designed to view many metric/focus pairs. In the figure above, there are seven foci and two metrics, leading to 14 metric/focus pairs. Barchart can easily handle far more; it is not unusual to display 30 or more foci, and five or more metrics. This contrasts with the Histogram visi described above, which is restricted to eleven metric/focus pairs at a time. However, Barchart has no way to show how metric/focus pairs change over time.
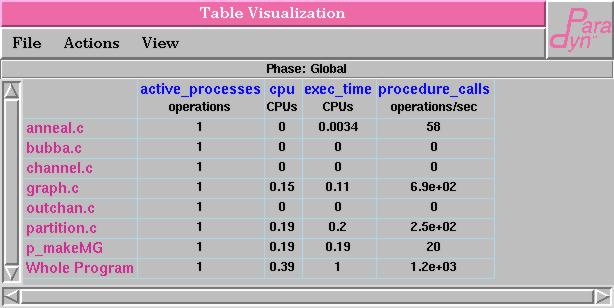
Like Barchart, the Table visi uses screen real estate efficiently. It can show many metric-focus pairs at a time. For example, the figure above has four metrics and eight foci for a total of 32 metric-focus pairs. It is reasonable for a Table to show hundreds of metric/focus pairs at a time. However, like Barchart, Table cannot show how metric/focus pair values are changing over time.
For more information see the Paradyn User's Guide